Using Google Analytics to Understand Your Audience

SUMMARY: Google Analytics 4 shows you who’s visiting your tourism website, where they’re coming from, and what they do once they arrive. Key reports include Real-Time (current activity), Life Cycle (how people find you, what they engage with, and whether they convert), User Reports (demographics, location, devices), and custom Explorations for specific questions. Use these insights to see which content keeps visitors engaged, where people drop off during the booking process, which marketing channels work best, and whether your site performs well on mobile. GA4 also uses data modelling to provide reliable patterns even when privacy settings limit tracking.
Marketing a tourism business today takes more than intuition—it takes insight. Whether you’re promoting a boutique hotel, a winery tour, or a multi-day adventure package, knowing who your visitors are and how they interact with your content is essential.
What inspires them to book? What captures their attention? And where are they coming from? These aren’t just nice-to-know details—they’re the foundation of smart marketing. When you understand your audience, you can make more informed decisions about what to promote, where to advertise, and how to connect with the right travellers at the right time.
The good news? You don’t have to figure it out alone. There are free tools like Google Analytics 4 (GA4) that can help you turn visitor activity into clear, useful insights. GA4 is Google’s latest analytics platform—and as of July 2023, it’s now the default version, replacing Universal Analytics.
Through the Google Analytics dashboard, you can learn details about your website and app visitors and create advanced audience segments based on information such as:
- Age and gender
- Locations and languages
- Devices most used to browse
- Most and least visited pages
- How often visitors return to your website or app
- And so much more…
What’s New in GA4 (and Why It Matters for Tourism)?
If you’ve used the older version of Google Analytics, GA4 might look a little unfamiliar. But don’t worry—these changes are designed to give you clearer, more useful information about your visitors.
Here’s what’s changed:
Events instead of sessions
GA4 doesn’t just track visits — it tracks everything your website visitors do like clicking a link, scrolling through a page, or making a booking. This gives you a more complete picture of how visitors are interacting with your website.
You choose your goals (Conversions)
Want to track bookings, newsletter signups, or people who watch a video? You get to decide what matters most for your business, and GA4 tracks those as conversions.
Engagement rate vs Bounce rate
Previously, Google focused on bounce rate, the percentage of people that “bounced” or left your website quickly; GA4 instead looks at Engagement Rate—which tells you if people stayed on your site and explored a few pages, or if they took action.
New report layout
GA4 groups reports around the customer journey, so you can see how people discover your site, what they do once they’re there, and if they come back later.
These updates mean you can better understand how potential visitors are finding you, what content gets their attention, and what helps them move from browsing to booking.
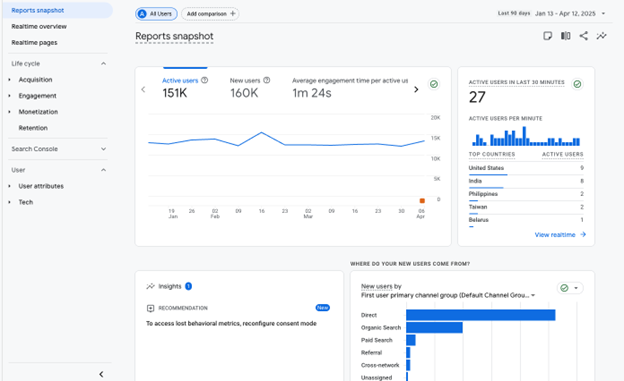
Google Analytics Reports Snapshot
Digging Into GA4’s Most Useful Reports for Tourism Businesses
Google Analytics collects aggregate data about the people who visit your website or app — things like where they came from, what pages they viewed, and what device they used. When you first set up GA4, it gives you a few built-in reports to help you understand your audience.
Here’s a breakdown of the main report categories that are set up by default in GA4:
Real-Time
See what’s happening on your site right now. This report shows how many users are currently active, where they are located, what pages they’re viewing, and what traffic sources (like search or social media) brought them in. Great for checking if a campaign or post is driving immediate traffic.
Life Cycle Reports
These reports follow the customer journey—from the moment someone discovers your site to when (and if) they return. They’re broken down into four key areas:
-
- Acquisition – See where your visitors are coming from, like Google search, social media, from your newsletter or direct traffic.
- Engagement – Understand what people do on your site: what pages they view, how long they stay, and whether they interact with content.
- Monetization – For sites that sell products or services, this shows revenue, purchases, and checkout behaviour.
- Retention – See how often users come back and how well you’re keeping their interest over time.
User Reports
If you want to know more about who’s visiting your site, GA4’s User Reports give you a snapshot of your audience so you can better tailor your web content and marketing. This section is broken down into two main sections:
-
- Demographics – See details like age, gender, location, and interests (when available)—for example, whether your visitors are into travel, food, or adventure.
- Tech – Learn what devices, browsers, and operating systems people are using, and whether they’re visiting your site from a phone, tablet, or desktop.
Explorations (Custom Reports)
Explorations let you build custom reports to see exactly how people are interacting with your site. This is where you can dig deeper into your data and answer specific questions.
You can explore things like:
-
- Funnels – See where users drop off during key steps (like booking or checkout)
- Paths – Understand what people do before or after visiting a specific page
- Segment overlaps – Compare different audience groups and how they behave
- User journeys – Follow the full path of individual users on your site
Now, let’s dive a little deeper into each of these:
Google Analytics Real-Time Overview
The Real-Time tab shows what’s happening on your website right now — within the last 30 minutes. This helps you see if your latest campaign, post, or promotion is working right away. You’ll know what’s getting attention and where your audience is coming from.
What you’ll see:
- How many visitors are currently on your site
- What pages they’re viewing
- Where they’re located
- How they found your site (social media, email, search, etc.)
- Whether they’re new or returning visitors
Use this report to quickly spot trends, monitor live campaigns, or make sure everything’s running smoothly during a launch or event.
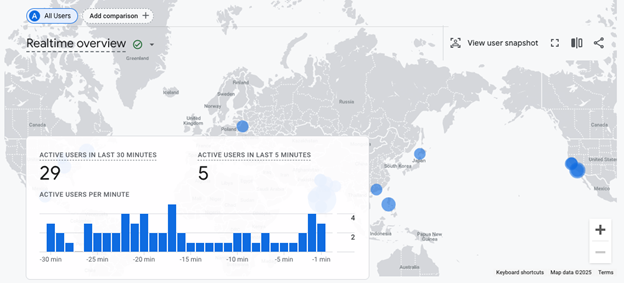
Google Analytics Realtime Overview
Life Cycle Reports: Acquisition Overview: How People Find You
Ever wonder how travellers are discovering your website? The Acquisition section in GA4 tells you exactly that. Whether visitors find you through Google Search, Instagram, paid ads, emails, or by typing your URL directly, this report breaks it down so you know what’s working—and what’s not.
What you’ll see:
Acquisition Overview
Get a high-level snapshot of where your website traffic is coming from—whether it’s organic search, social media, referrals, direct traffic, paid ads, or email campaigns. Great for quickly comparing what channels are performing best.
User Acquisition (First User Source/Medium)
See how people found your site the very first time. This helps you understand which channels are helping you reach new potential visitors. For example, if most first-time users came from Instagram, you might want to keep investing there.
Traffic Acquisition (Session Source/Medium)
This section looks at all sessions, not just the first one—giving you a deeper view of how people return to your site and through which channels. It’s great for tracking ongoing campaign performance, returning user behaviour, and repeat visits that lead to bookings or inquiries.
These reports are especially valuable when you’re running marketing campaigns or partnerships. Want to know if that travel blog feature actually sent traffic your way? Or if your paid social ads are driving bookings? This is where you’ll find the answers.
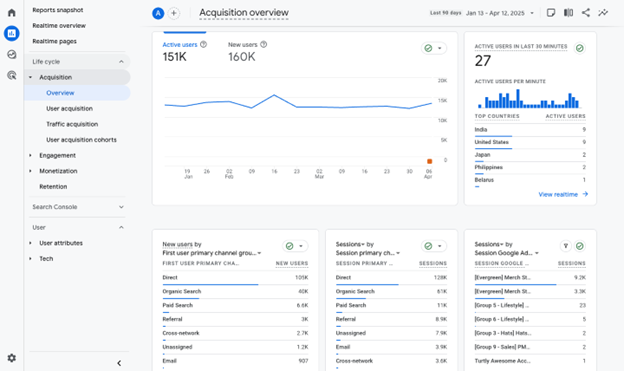
Google Analytics Acquisition Overview
Lifecycle Reports: Engagement & Conversions: What Visitors Do on Your Site
Once visitors land on your site, what do they actually do? The Engagement section in your GA4 reports shows how visitors are interacting with your content—how long they stay, what they click on, and what pages are keeping their interest.
This is where you find out if your content is working. Are people browsing your event calendar? Clicking through your itineraries? Reading about your wine tours or travel tips? This section tells you what’s capturing their attention—and what’s not.
What you’ll see:
Engagement Overview
See an at-a-glance view of how much time people are spending on your site, how many pages they visit, and your Engagement Rate. Unlike the old “Bounce Rate,” this newer metric highlights meaningful activity—like scrolling, clicking, or watching a video—rather than just whether someone left quickly.
Events
GA4 automatically tracks many basic actions as “events” (like page views, scrolls, video plays, or file downloads), but you can also set up custom events to track tourism-specific interactions—like clicking “Book Now,” using your trip planner, or viewing a location map. Events are the foundation for measuring Conversions.
Pages and Screens
See which pages are keeping people engaged the longest. Are users diving into your blog about hidden hiking spots, or are they leaving quickly from your homepage? This helps you fine-tune your content and layout for better performance.
Landing Page Report
Find out which pages people arrive on first when they visit your website. This is especially helpful for understanding which blog posts, experience pages, or campaign landing pages are drawing traffic. It can also help you optimize those pages to guide visitors toward next steps—like booking, exploring more content, or signing up for a newsletter.
Use these reports to help you understand what content is working. The more you understand how visitors engage with your site, the easier it is to turn curiosity into bookings.
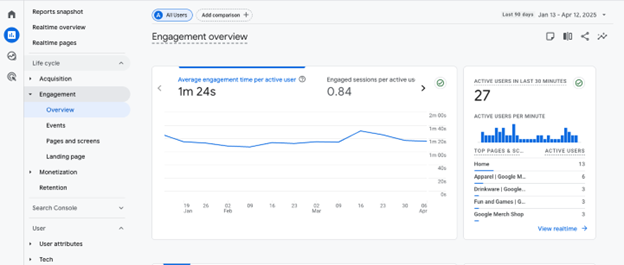
Google Analytics Engagement Overview
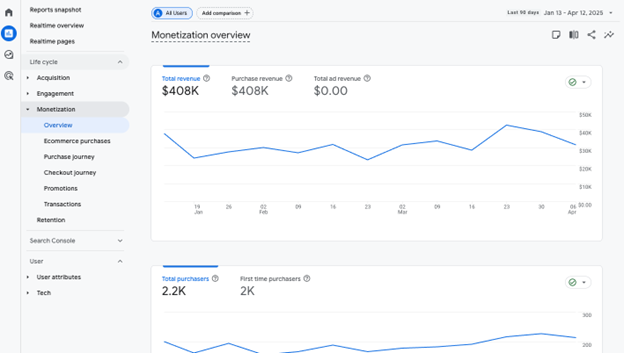
Lifecycle Reports: Monetization – Tracking Revenue on Your Website
The Monetization tab in GA4 helps you understand how your website (or app) is generating revenue. For tourism businesses, this could include online bookings, product sales, gift cards, or vacation packages. While GA4 doesn’t track purchases automatically, with the right setup, this tab can give you clear insights into what’s selling—and what’s driving that revenue.
What you’ll see:
Overview
A snapshot of your total revenue, number of purchases, average revenue per user, and top-selling products or services. Great for spotting trends at a glance.
Ecommerce Purchases
Detailed reporting on each item or service sold. See how often something was viewed vs. purchased—helpful for understanding interest vs. action (like a popular page that isn’t converting).
Checkout Journey
See how visitors move through your booking or checkout process. This helps you spot where people drop off—whether it’s at the cart, entering payment details, or the final confirmation.
Purchaser Report
Learn more about who is completing purchases. See trends by country, device, or returning vs. new users. Great for understanding who your paying customers are—especially helpful if you’re marketing to different types of travellers (local vs. international, mobile vs. desktop).
Monetization reports give you powerful insights into what your visitors are buying and where they might be getting stuck. With the right setup, you’ll be able to see what’s driving revenue—and where there’s room to improve the path to purchase.
Google Analytics Monetization Overview
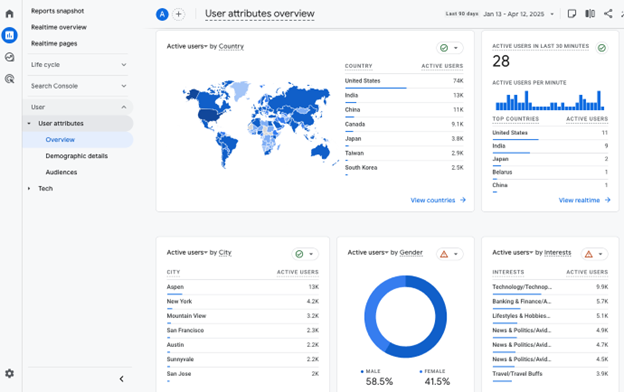
User Reports: User Attributes: Who’s Visiting Your Website
The User Attributes section gives you a breakdown of visitors exploring your website by age, gender, interests, language, and location. This is especially useful when you’re trying to understand if your experiences are attracting families, solo travellers, adventure-seekers, or cultural explorers.
You can also see Geographic reports showing where your visitors are located—from the country level down to the city. Tourism businesses can use this to help shape and understand where potential travellers are coming from and if they should be supplementing any advertising in that area, such as advertising.
What you’ll see:
- Overview: A snapshot of your audience, including age ranges, gender (if available), country, and top interests. Use this for a quick look at who’s engaging with your site and where they’re from.
- Demographic Details: A more detailed breakdown of visitor traits—like age, gender, language, and location (from country to city level). This can help you identify patterns, like whether you’re attracting more local visitors or out-of-province travellers, and adjust your marketing strategy accordingly.
- Audience: This section lets you view and create groups of users based on shared traits or behaviours. Some basic audience data is available by default, but you also have the ability to build custom audiences that reflect your specific goals or campaigns.
For example, you can create audiences like:
- Visitors who spent more than five minutes on a cultural experience page but didn’t book
- Users who came from Instagram ads and visited the events page
- Return users from Alberta (or other destination) who viewed winter packages
These custom audiences are incredibly valuable for tourism marketing—especially for remarketing, campaign targeting, and understanding travel intent across regions and demographics.
Learn how to build custom audiences.
Google Analytics User Attributes Overview
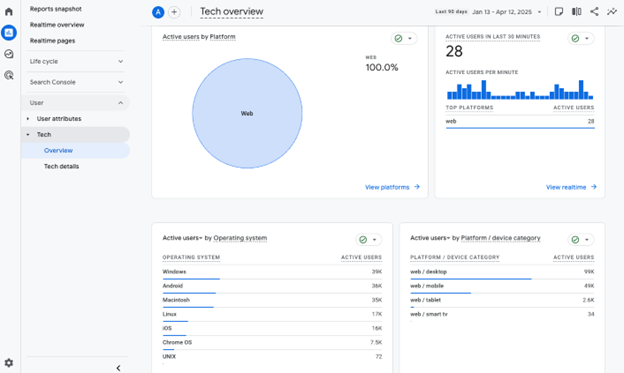
User Reports: Tech: How Visitors Are Viewing Your Site
The Technology tab shows you how people are accessing your website—whether they’re on a phone, tablet, or desktop. For tourism businesses, this matters more than ever. Many travelers research, plan, and even book while on the go, so knowing which devices and browsers they’re using can help you make sure your site is working smoothly for them.
If your mobile experience is clunky or pages aren’t loading well on certain devices, this section can help you catch those issues before they cost you bookings.
What you’ll see:
Overview
A summary of the most common devices, browsers, and operating systems your audience is using. Quickly see if most visitors are on mobile, or which browser they prefer (e.g. Chrome, Safari). This helps you prioritize testing and optimize your site for the platforms your audience actually uses.
Tech Details
A deeper look at exactly how people are accessing your site, including:
-
- Device category: Mobile, desktop, or tablet
- Browser and OS combinations: Like Chrome on Android or Safari on iPhone
- Screen resolution and size: Helpful for making sure your site and images scale correctly. These details are useful for troubleshooting design issues, testing your booking engine, or refining how your pages load across devices.
Knowing how your visitors access your site ensures you’re delivering the best experience—whether they’re planning a trip from their laptop or booking a last-minute tour on their phone. With the Technology tab, you can catch display issues early and make smarter design and development decisions.
Google Analytics Tech Overview
Data Modeling and Privacy
GA4 is built to work even when it can’t track every user action directly. It combines data from cookies, device IDs, and machine learning models to fill in the gaps and provide a clearer picture of visitor behaviour.
With growing privacy protections—like cookie consent banners and iOS tracking limits—some users choose not to be tracked. Instead of leaving those visits blank, GA4 uses smart data modelling to estimate trends and interactions. While the data isn’t perfect, it’s designed to give you reliable patterns so you can still make informed marketing and website decisions.
Final Thoughts and Next Steps
GA4 isn’t just a fancy analytics tool—it’s a powerful way to grow your tourism business. With the right insights, you can improve your website experience, connect with the right visitors, and create content that truly resonates.
You don’t need to be a tech expert to get started. Google’s free Analytics Academy offers helpful beginner-friendly courses, and the GA4 Help Center is always available when you’re stuck.
Let the data work for you—so you can focus on what matters most: creating unforgettable visitor experiences.
Digital tools and platforms used in tourism marketing evolve quickly. Features, algorithms, interfaces, AI and even how travellers find or engage with your content may change over time. This article is designed to stay relevant for tourism businesses in BC, but processes, settings, and terminology can shift. For the most accurate and current information, always check the official documentation or help pages of the tools and platforms you use to share, advertise, or manage your tourism business online.
Last updated: July, 2025