
Getting Started with Google Analytics and Social Media Metrics
Impactful marketing strikes the perfect balance between creativity and science. Creativity is what brings us compelling headlines, beautiful videos, and clever social media captions. Science–the analytics–is what we use to measure and improve the effectiveness of that work.
Analytics tells us what has performed well in the past and what trends may be surfacing. Analytics also tells us what’s working now, what can be tweaked, and what can be leveraged even further. This article will cover both Google and Social Media analytics.
One of the best places to get started is with Google Analytics (GA). This quick overview of GA will help you become familiar with the terminology AND the possibilities at your fingertips. Afterwards, to do a deep dive, explore the full set of free online courses that Google offers.
What is Google Analytics?
Google Analytics is an analytics service offered by Google that collects aggregate data about how people use your website and apps. Google tracks this data to create reports that provide you key information about your website and app data, as well as analyzing the visitors journey on your website in detail through measured audience metrics.
What Kind of Information Can Google Analytics Tell Us?
You can use Google Analytics to discover the behaviour of those visiting your website or app, including what pages they are visiting, and whether your goals are being accomplished (purchase, bookings, inquiries etc.). These details and insights can help you develop strategies to refine your marketing efforts.
There are several audience metrics listed in Google Analytics, but the main available insights you should be paying attention to in order to track, visualize, and gain information about your audience are as follows:
Users
Users is the most-tracked Google Analytics metric. Google Analytic’s GA4 has three user metrics:
Total Users: Total number of unique users who logged an event.
New Users: Number of users who interacted with your site or launched your app for the first time
Active Users: The number of users that has had an engaged session on your website or app. Google’s definition of an engaged session includes a session that meets at least one of the following criteria: session lasted longer than 10 seconds. triggered a conversion event, viewed 2 or more pages.
Any time a new visitor lands on your website or app, Google Analytics assigns them a unique ID. If the user returns to your site again later using the same browser, Google Analytics will log it as a returning user, however, if the user visits your website a second time using a different browser or through an app, they will be assigned a new client ID, and Google Analytics would count this visit as a new user.
Sessions
A session is the period of time a user is active on your site or app. If a user is inactive for 30 minutes or more, any future activity is attributed to a new session. If a user is viewing the website or app at midnight, a new session is not activated.
Pageviews
A pageview is a view of a page on your website or app by a user. The pageview metric shows how often visitors load, and reload, your web and app content in their browser.
Pages/Session
Pages per session is a standard Google Analytics metric that’s commonly used to measure engagement. Each session counts the number of pages visited as they proceed along their visitation path. Pages/Session can help determine how well the visitor flows through your content by displaying how many pages are visited before completing a conversion.
Average Session Duration
This metric records the average length of a session in hours, minutes, and seconds. The more relevant your site content is to the visitor, the longer the average session duration will be. Average session duration is calculated by total duration of all sessions (in seconds) divided by the number of sessions.
Bounce Rate
Google Analytics previously identified a bounce rate as anyone that visited a single page of a website or app with no event triggered. However, with the increased focus on long form content, Google has now changed how they calculate bounce rate. A bounce rate is now defined as the percentage of sessions that were NOT engaged.
Google’s definition of an “engaged session” includes a session that meets at least one of the following criteria:
-
- lasted longer than 10 seconds
- triggered a conversion event
- viewed 2 or more pages
In other words, someone who spends 10 minutes reading an article on your blog and then leaves your website, it will NOT count as a bounce, as it did previously.
As always, the goal is to focus on having a lower number; Most websites have an average bounce rate of around 50% and any bounce rates under 50% are typically considered very good.
New Sessions
% New Sessions is the total percentage of first-time sessions on your website in a given time period. It tracks the number of new visitors coming to your website, and the extent to which you are encouraging them to return. This percentage of new visitors indicates how well your advertising and marketing draws in new potential customers.
Traffic Acquisition
The Traffic acquisition report is designed to help you understand where your website and app visitors are coming from. The traffic acquisition report tells you where users came from, including organic search, paid campaigns, social media, etc. You can use the information in your traffic acquisition report to make decisions about future marketing campaigns and determine the efficacy of your marketing efforts, where you should be spending more time and what areas are underperforming.
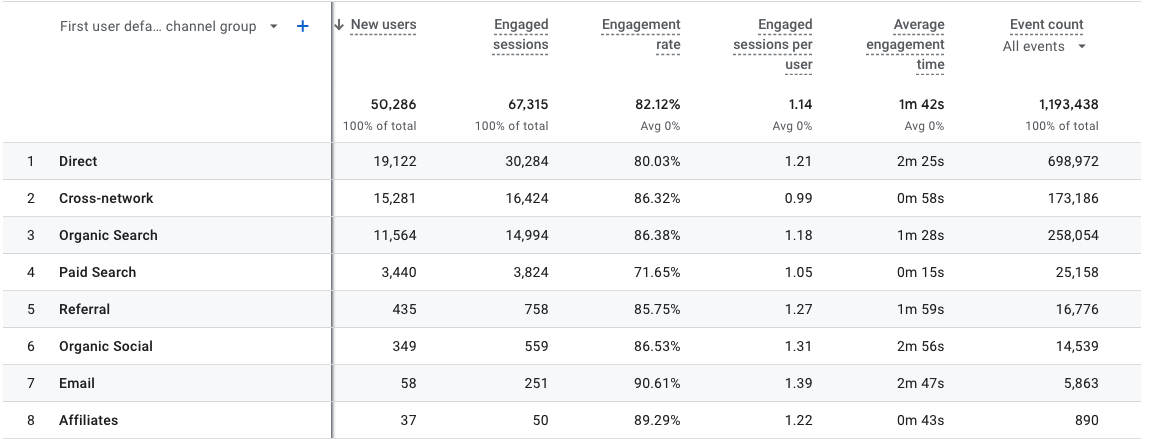
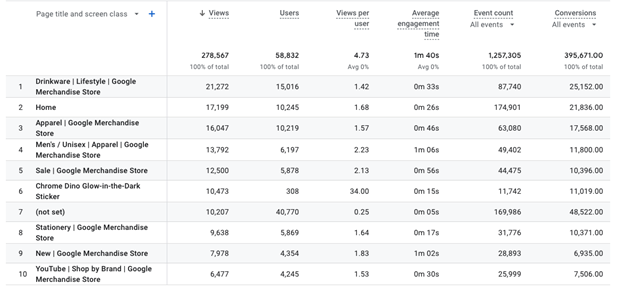
Google Analytics provides detailed information about how your content is performing.
Social Media Analytics
Of course, measuring website activity and the triggers that drive people to your website is only one part of the story. Social media is an important part of any digital strategy. That means we must also dig into social media analytics to determine things like what to post, when to post, and how much to post.
There are number of tools and services you can use to pull social media analytics. These include social media management tools such as HootSuite and Sprout Social and the proprietary reporting capabilities of the platforms themselves (e.g. Facebook analytics).
Regardless of what source you ultimately use, there are a similar set of measurements you’ll want to keep your eye on:
Follower Growth Rate
Follower growth rate helps you determine whether your content (and, by extension, your business) is expanding its audience reach and catching new people’s attention. The percentage of change in your follower count tells you about the health of your marketing campaigns and efforts. It is calculated by dividing the number of followers you gained over the previous month by the number of followers you had at the beginning of it.
Total Followers
This metric indicates how many users are actively following your business account, indicating that they are interested in learning about important updates and seeing your content.
Engagement Rate
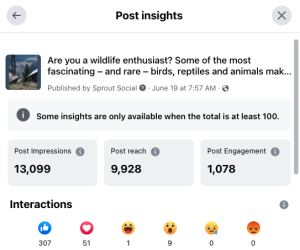
Engagement rate measures the amount of interaction social content earns relative to reach or other audience figures. It is calculated by dividing your total engagements (likes/comments/shares/taps forward/taps back/replies/retweets on stories) by your follower count. This metric helps demonstrate performance trends in your content, and determines what content resonates best with your audience. For example:
Total Followers on Facebook Page: 8,058
Total Engagment Rate on this Post: 1,078
Engagment rate = 0.1337 (13.37%)
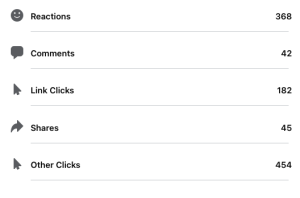
Total Engagements
Your total engagements count is the sum of the audience interaction with your content over a period of time. This total demonstrates how engaged your audience is with the content you are posting or promoting.
Impressions
Impressions is a measurement of how many times your content was displayed, regardless of whether it generated a click or any other form of engagement.
Organic Impressions: How many times your content was shown in your followers’ feeds or on your official page.
Paid Impressions: How many times your paid content (sponsored ad or boosted post) was shown to your target users.
Reach
Reach measures how many people are seeing your content by counting actual views of your posts. This metric is different from impressions because if the same person sees your post three times, that will count as three impressions, but, three views of the post by one individual is only counted once for reach.
Total Posts
Your total posts metric indicates how much content you posted on your social channel during a certain time period. It is important to track this metric as it can help you determine whether your audience is responding well to the amount of content you are producing, or if you are oversaturating their feeds.
What’s Next?
Now you have a high-level view of what to measure on your website and on your social channels. The trick is to use these metrics to gather the following insights:
-
- What content is your audience responding to?
- What social content is driving social media audience to your website?
- What social posts are under-performing?
- What social posts are over-performing?
- Who is arriving at your website and what are they interested in?
- What are some ways you might further engage visitors to your site?
These insights can be used to:
-
- Determine what website content to edit, update, eliminate or add more of
- Determine what social content to concentrate on
- Identify strategies for growing your followers
- Establish the right cadence and frequency for your social posts
With this information, you are now ready to start combining creativity with analytical insights to drive stronger results. For more details and background on analytics, please explore the articles and sources used for this article:
Sources:
Google Analytics: 7 Important Audience Metrics to Track
The 10 Most-Tracked Google Analytics Metrics
The Audiences Report
Analytics Help
10 Good Reasons Why You Should Use Google Analytics
7 Instagram Metrics You Should Track to Measure Performance
7 Essential Instagram Metrics to Measure Performance
All the Different Ways to Calculate Engagement Rate
Last updated: June, 2023